A goodman diagram is widely used in engineering fatigue applications. Why do we care so much about a goodman diagram? A goodman diagram will be able to tell us whether a part can be subject to finite or infinite cycles.
Fatigue in engineering is a very interesting concept. Parts can be subject to stresses much lower than their allowable limits (factor of yield or ultimate tensile strength). As a result, they fail because they’ve been subject to multiple cycles.
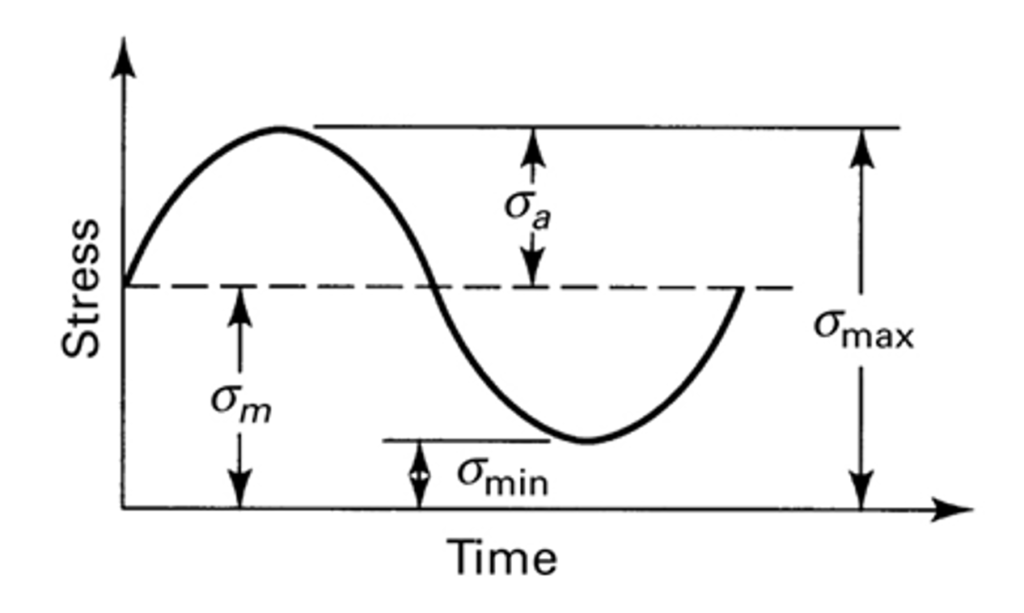
What do we mean by multiple cycles? By multiple cycles, we mean that a part or a system running over and over again. An easy example is RPMs in a motor. The shaft in a motor will be subject to repeating stresses. As a result, we can characterize them by altering and mean stresses. The variable weight distribution and the loading on the shaft will be subject to a minimum and maximum stress.
March 2, 2024
Mathematically, the mean and alternating stresses can be expressed as:

What is a goodman diagram?
A modified goodman diagram shows the mean stress and plots it along all other components of stress which is going to be plotted on the origin.
The goodman diagram shows how a product will fail given a high number of cycles.
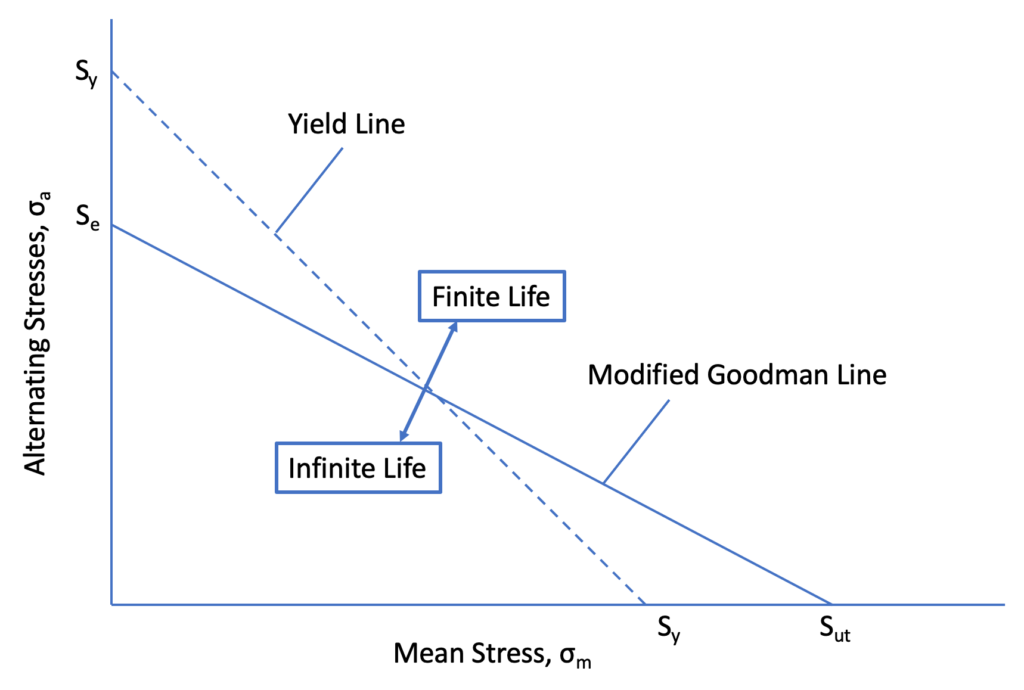
An easy way to interpret the goodman diagram is looking at the goodman line. All stresses above the modified goodman line will indicate that the component has finite life. Whereas the stresses underneath the modified goodman line indicate infinite life.

What is the modified goodman line?
The modified goodman line represents the threshold between the part’s alternating and mean stresses and it’s lifecycle.
If the part is subject to high stresses above the modified goodman line, then we will see finite life and therefore a failure at a certain number of cycles.
If the part is subject to low stresses below the modified goodman line, then we will see infinite life and not have to worry about fatigue failure.
The modified goodman line, as seen in the figure above is determined by endurance limit and ultimate tensile strength. Depending on some of the assumptions made upon engineering the product, this will change the endurance limit and change the value where the part can be subject to either finite or infinite life.
Why do we need to use a goodman diagram in engineering?
If you’re a mechanical engineer or a structural engineer, you will need to make sure that the parts pass a fatigue analysis.
his is so that the parts you send to the customer will perform to it’s intended lifecycle and not experience premature fatigue.
You will determine what the allowable stresses are based on material properties of the material that you are using and determine whether or not your part or system passes the analysis.
You will be submitting a report to the customer that details your diagram along with assumptions used to calculate endurance limit and whether your part will withstand infinite cycles or not.
Goodman diagram example problem
Below you’ll see some example problems that you will run into for a strength of materials course. The examples below utilize both a pressure vessel case and rotating shaft case. Both, which are common in oil & gas or electromechanical applications.
Pressure vessels are subject to repeating cycles such that you will be pressurizing a system in and out. Over a long period of time, this will result in fatigue.
Rotating shafts are similar in such as they’re subject to repeated bending or torsional loads.
Pressure Vessel
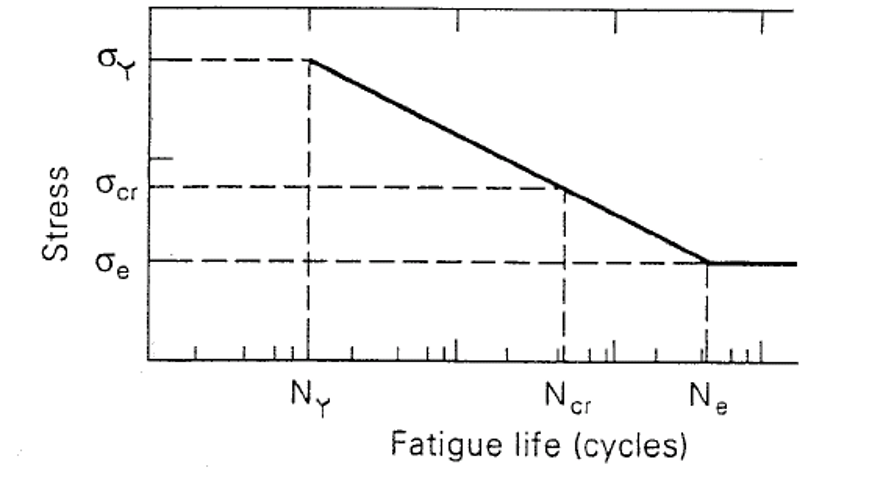
A thin-walled pressure vessel of mean radius R = 100 mm and thickness t (<<R) is subjected to cyclic internal pressure p in the range -3 MPa ≤ p ≤ 7 MPa. Using Soderberg’s relation, the S-N curve given below and safety factor of 2.6 determine

a) the number of cycles to failure if t = 5 mm.
b) the thickness t for “infinite life.”
Assume σY = 350 MPa, NY = 103, σe = 290 MPa, Ne = 107.
Rotating Shaft
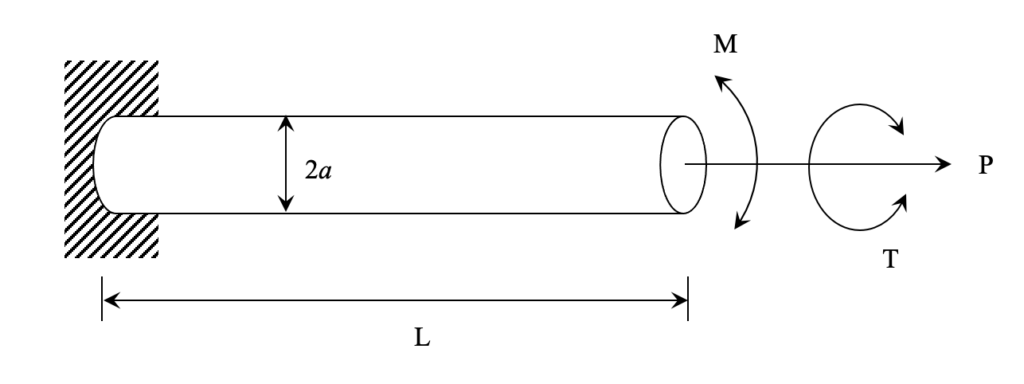
A solid circular shaft of radius a is subjected to the combined axial load P, bending moment M, and torsional moment T shown. Assume that M = Pa/4, T = Pa/2. The axial load is constant while the moments M and T are completely reversed cyclic. The material of the shaft has yield stress (σY) of 300 MPa and endurance limit (σe) of 150 MPa.
Assuming that a = 10 mm, calculate the value of P for infinite life of the shaft with a factor of safety of 3.

Applications of the goodman diagram in the industry
Applications that will need to incorporate fatigue analysis (using the goodman diagram) include oil & gas, aerospace, robotics, and more. At a high level, pretty much every mechanical engineering application you can think of will need fatigue analysis.
Parts that are mechanically engineered need to be designed to last a certain number of lifecycles.
If we look at some of the example problems above for a strength of materials class, we see those including a rotating shaft and a pressure vessel. Both are very common applications in the industry and as a result, it’s important to understand.
Electromechanical systems will include components such as motors, and by definition of a motor which has a rotating shaft, will be subject to fatigue.
Closing Thoughts
Fatigue is a very misunderstood phenomenon in the engineering industry. Engineering companies need to use tools such as calculating the endurance limit, interpret goodman diagrams, and submit analysis reports to the customer. As a result, the customer can sleep well at night knowing their system passes fatigue analysis.
Sometimes it’s very challenging in the industry to ensure that parts will pass analysis and be able to withstand operating conditions. This is why companies will spend tens of thousands of dollars (even more) on engineering analysis.
A fatigue failure will cause customers, engineers, project managers a ton of headaches and loss of sleep. Don’t be involved in a fatigue failure and make sure your parts are designed to withstand their operating conditions.
Strength of materials classes don’t do a great job of tying in why fatigue is important. Although the arithmetic portion of fatigue analysis is simple, it is difficult to understand the significance.
Interviewing for a mechanical engineering or structural engineering positions?
Check out: Structural Engineering Interview Questions and Strength of Materials Interview Questions – Top 23
About the author

Kazuyoshi Fujimoto, PE
Founder | Engineering Career Coach | Principal Mechanical Engineer
Kazu oversees all of ultmeche’s engineering services. He provides consulting such as resume reviews, rewrites, mock interviews, and all services career related. Additionally, Kazu performs consulting work regarding Oil & Gas, Automotive, and Aerospace & Defense. Kazu is licensed as a professional engineer in the state of California and has 9+ years of experience in Oil & Gas, Automotive, and Aerospace & Defense.

1 thought on “Goodman Diagram”